Grafana has a useful feature where you can add annotations to graphs. These annotations can be manually assigned (as shown below), or extracted from a database. To manually add annotations, click on the graph:
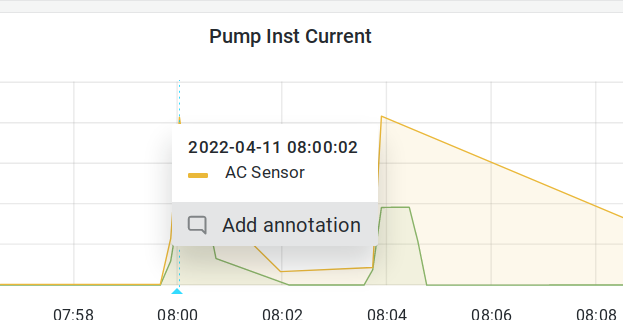
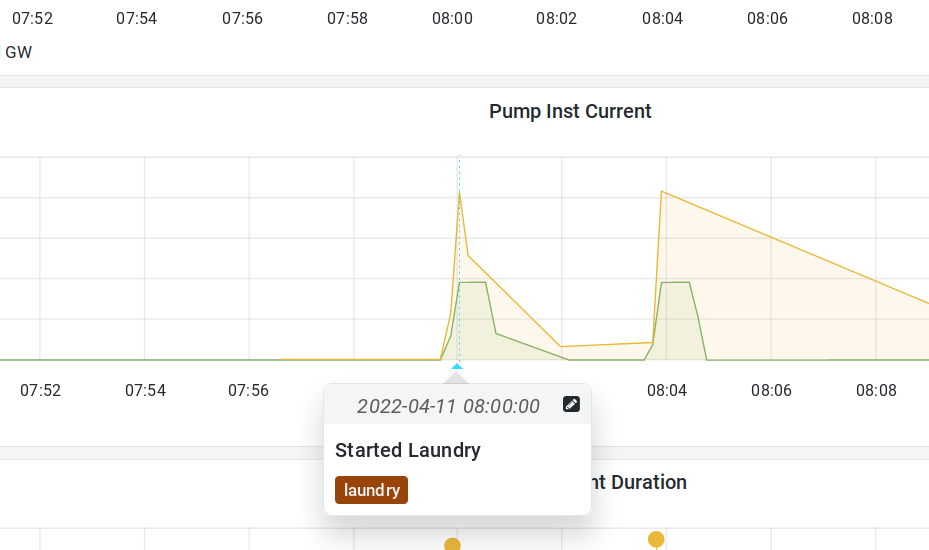
and press “Add annotation”. Then type in your annotation, add tags, etc. The annotation will then display as a blue triangle. Hover your mouse over the blue triangle to view the annotation:
You can also display your annotations as a list using the Annotations List panel.

Grafana is a very useful tool for displaying any type of time series data and annotations makes it easy to display events and notes with this data.