I’ve started rolling out SIOT to all the servers and other computers I manage. Pretty pleased with it so far – Ansible is used to deploy SIOT, set up the Systemd stuff, etc. Then tunnel in with ssh to get to the UI:
ssh -L8118:localhost:8118 <server>
Open up http://localhost:8118 and configure a sync to the SIOT portal node. After that, additional configuration changes can be made in the portal and it will push changes down the remote instance.
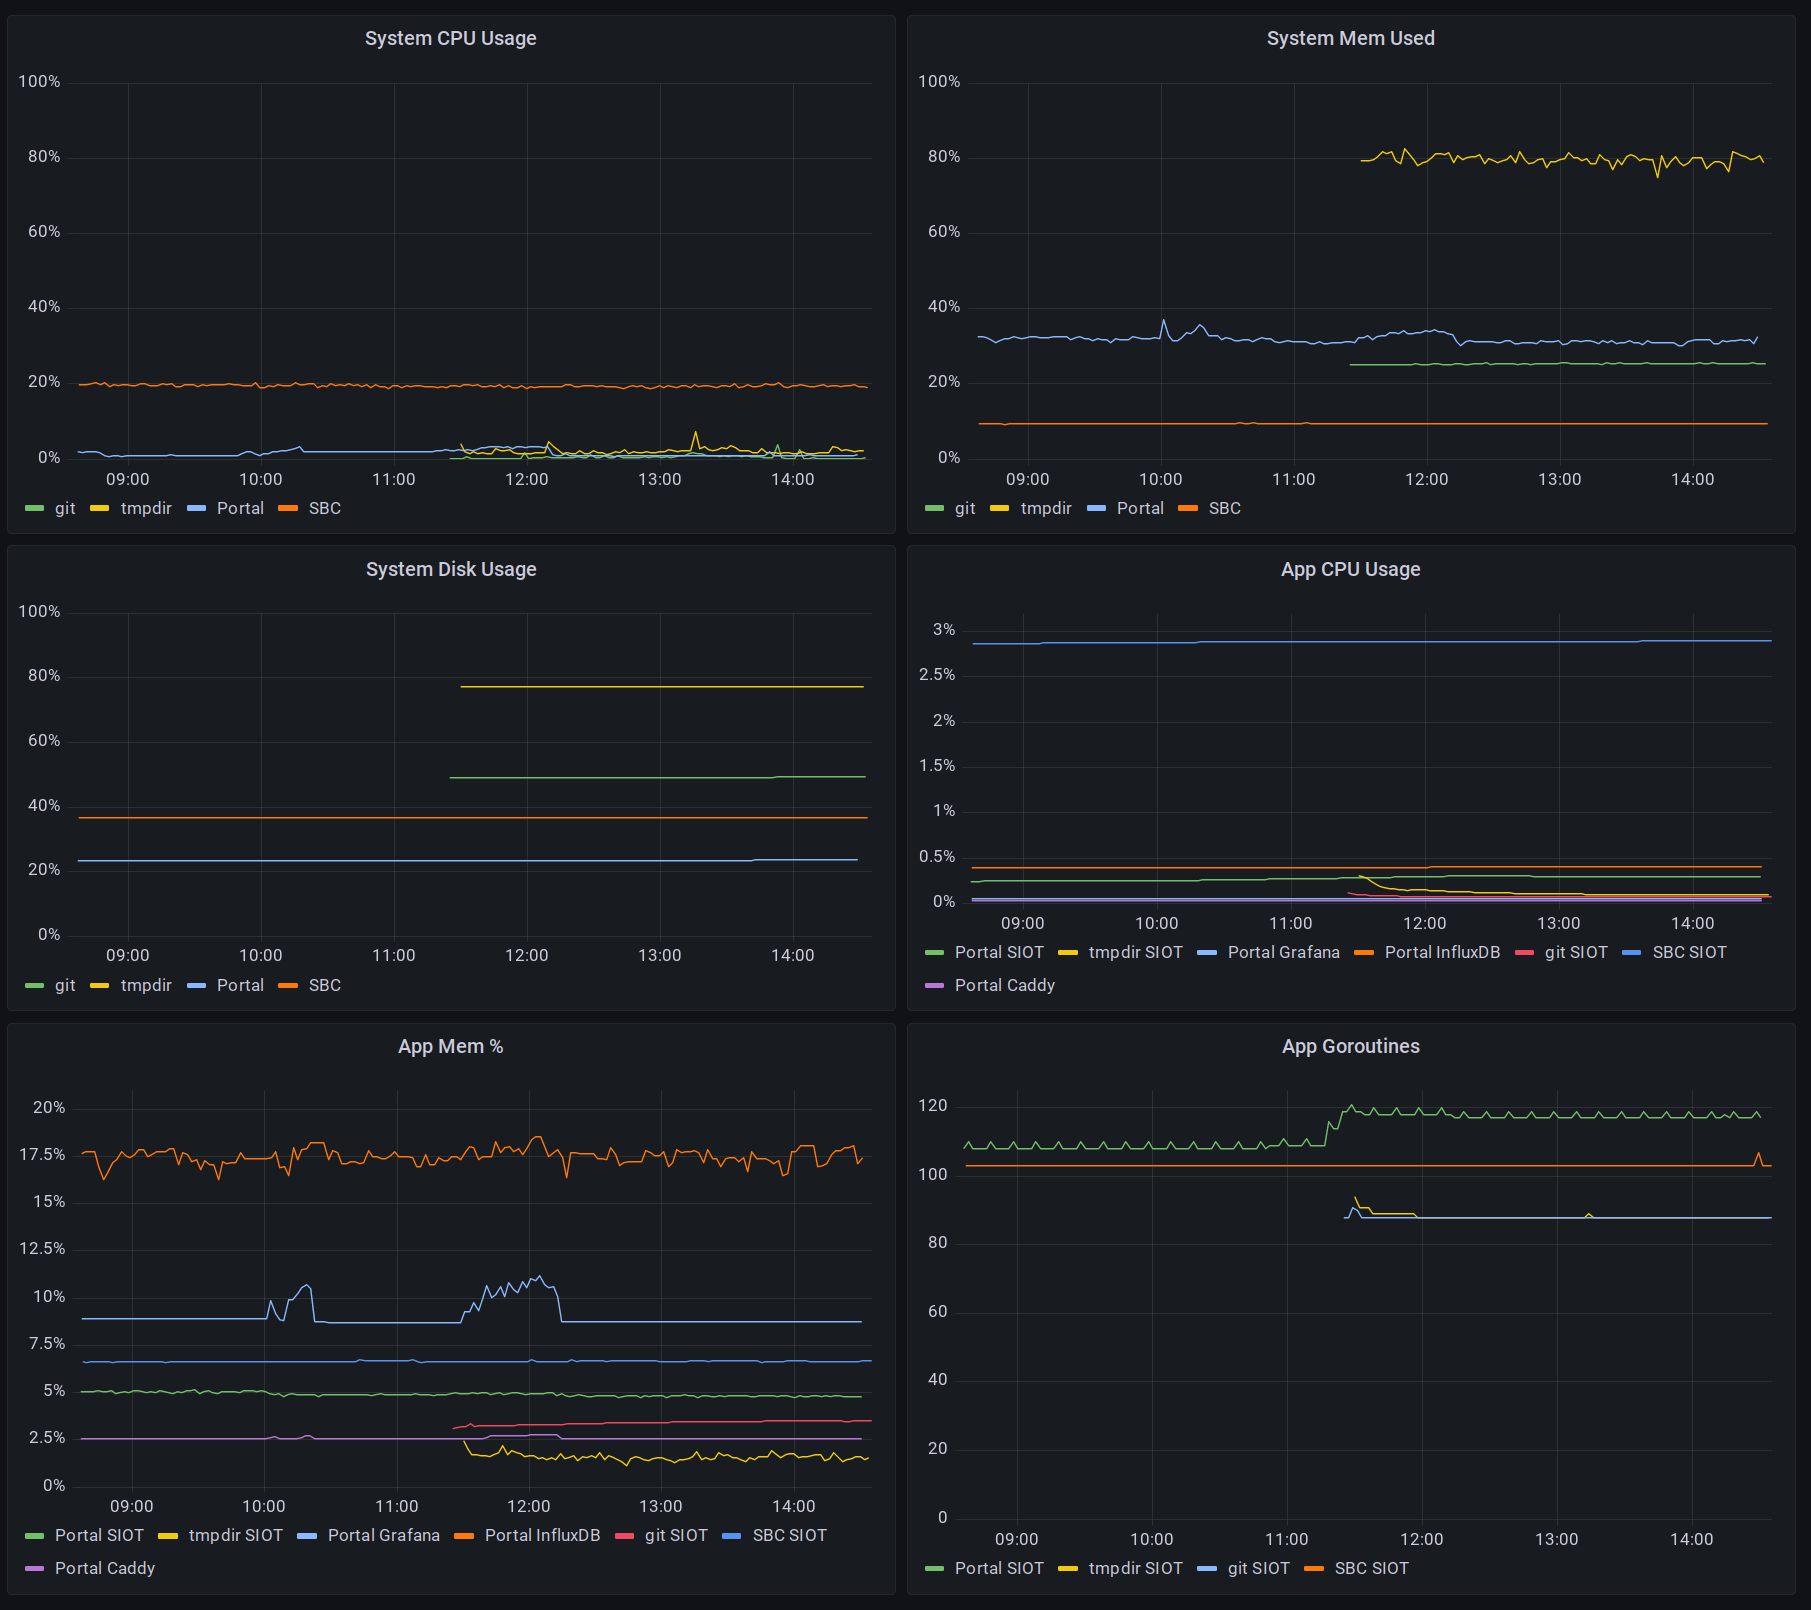
System and App metrics nodes can be added to collect system operating data. Additionally, if there are any other processes that need monitoring, additional monitoring nodes can be added to monitor named processes. For instance, on the portal, we monitor Grafana, Caddy, and InfluxDB.
So far, I’m fairly pleased with resource usage. SIOT is an easy way to monitor your systems and get metrics into Grafana.
The main pain point at this time is mapping the node UUIDs to descriptive labels in Grafana. Currently, I copy the node, note the UUID, and then add an override in Grafana for the Display name – eventually, we’d like to pull this directly from SIOT.